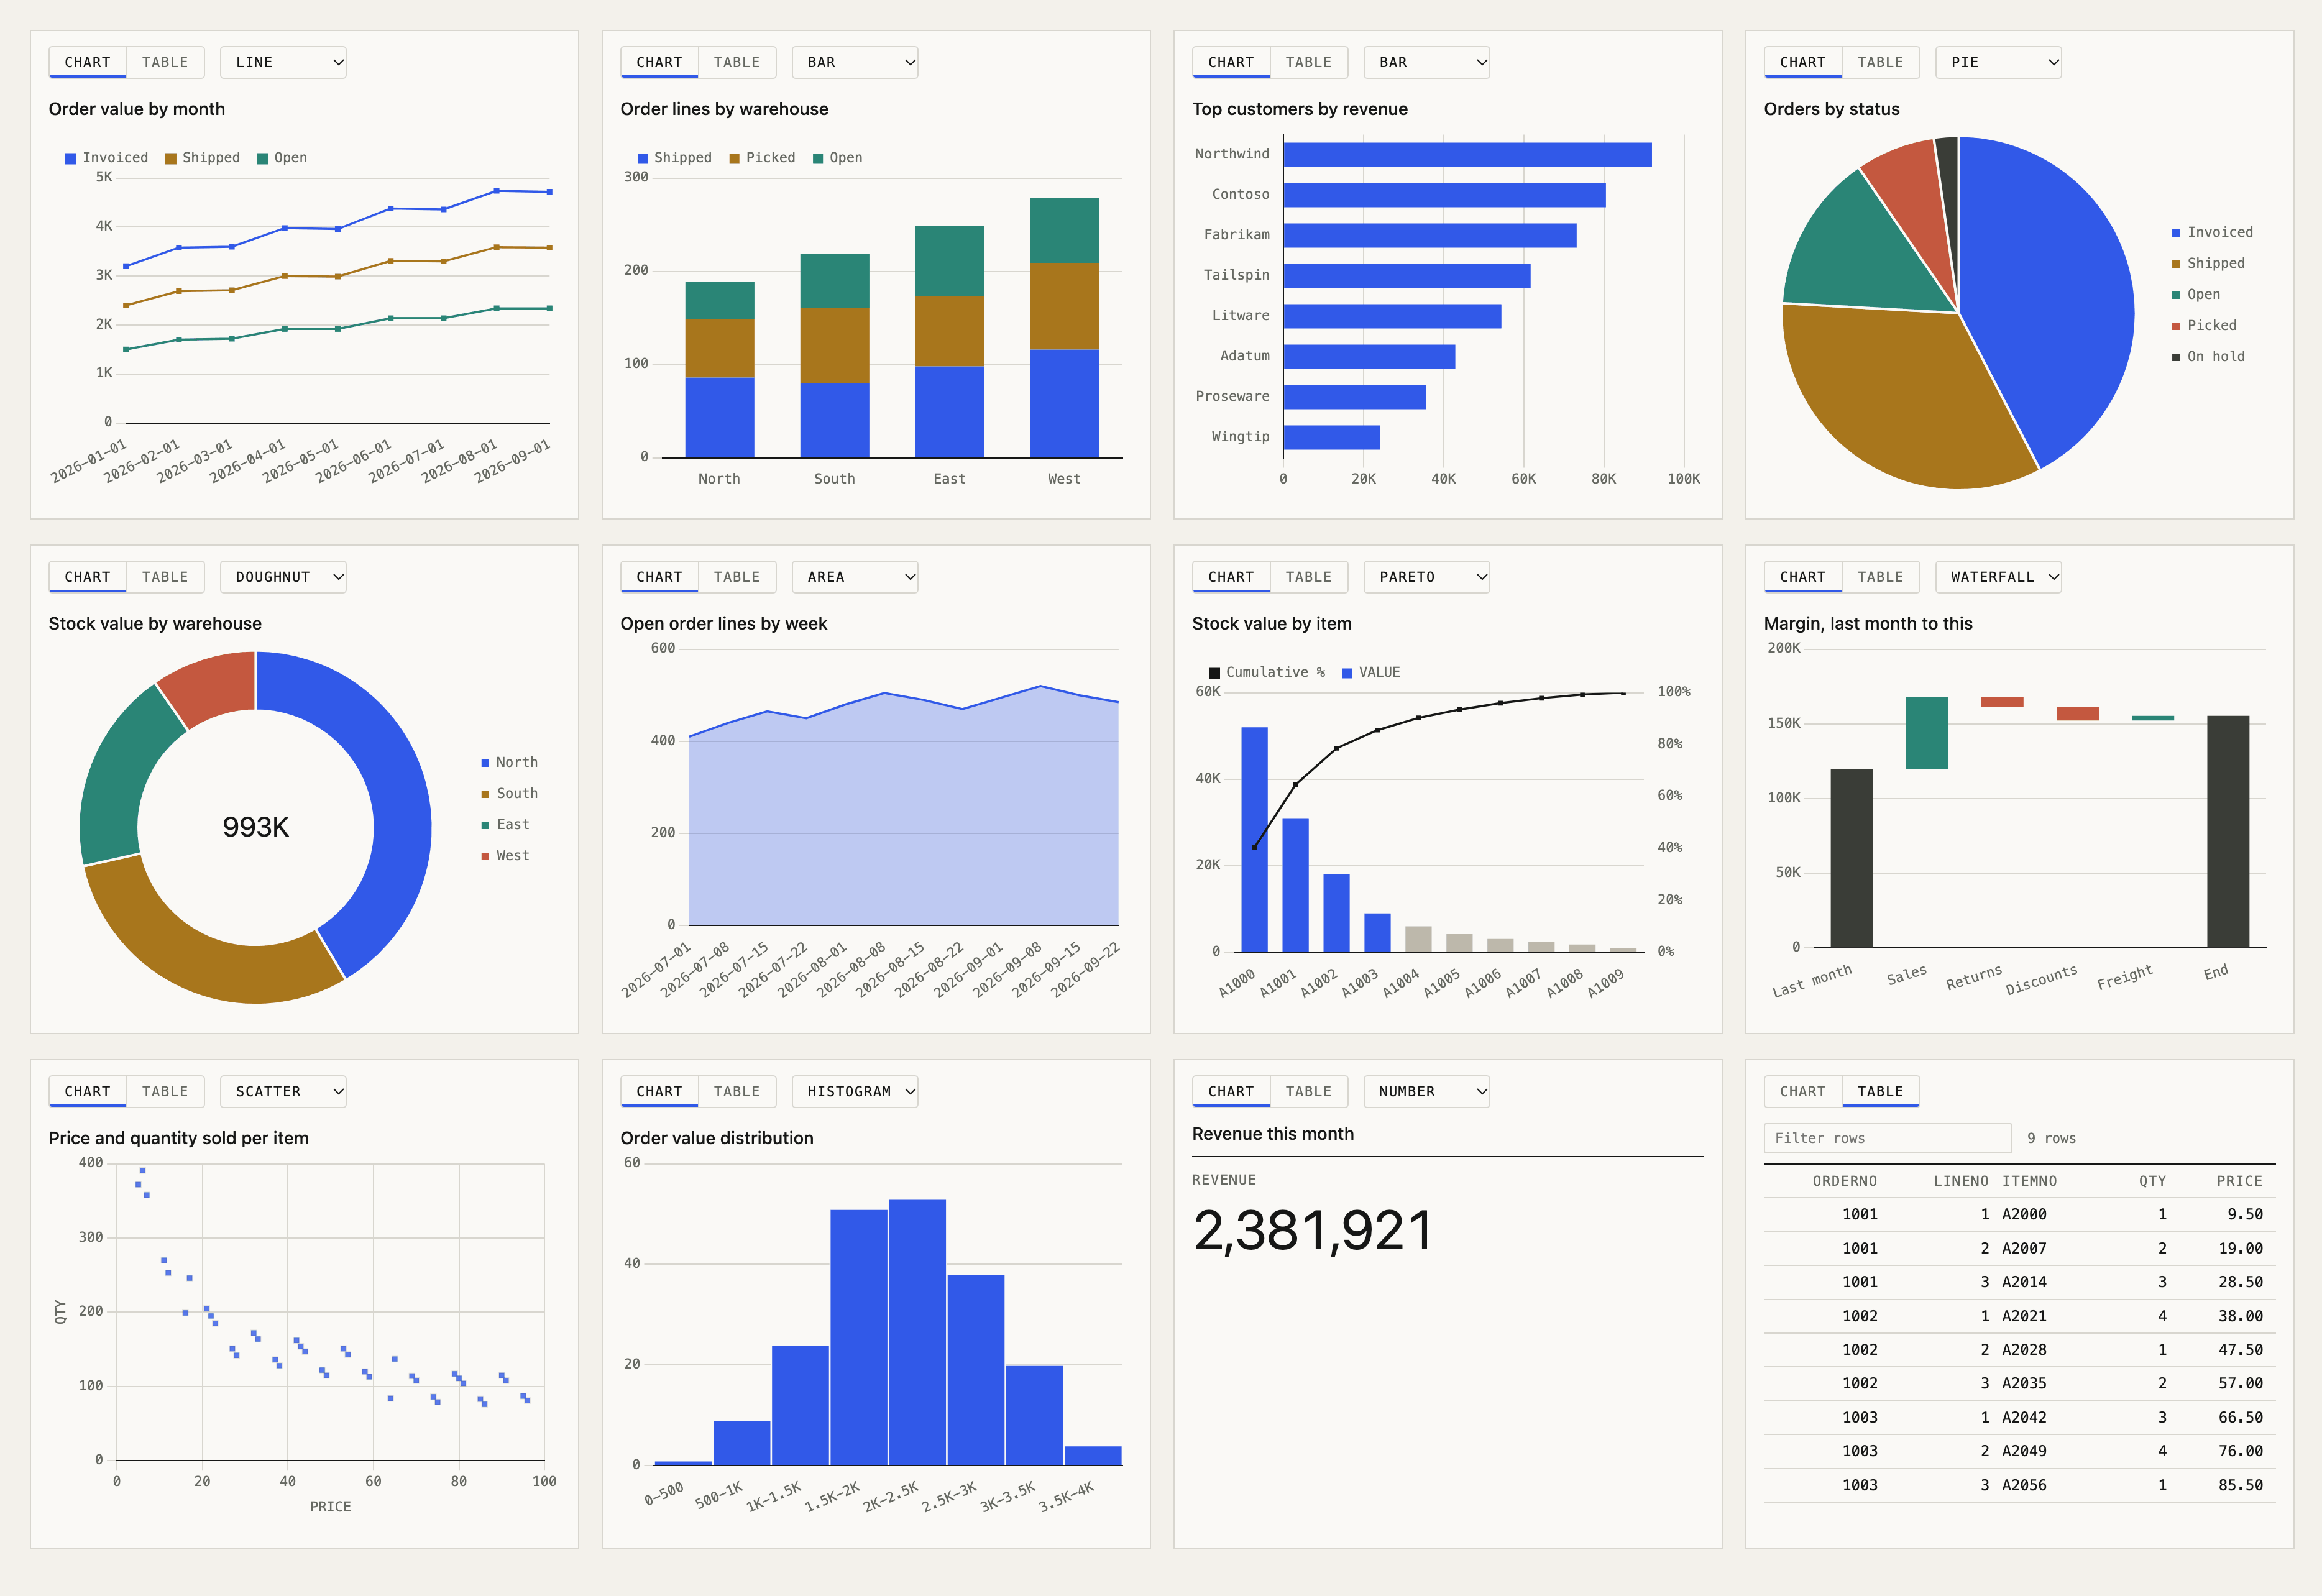
Until now, a query result reached the user as text. The model read the rows and wrote a summary, often with a Markdown table. That works for ten rows. It works less well for a year of monthly totals, where a line says more than a paragraph. Version 3.8 adds a result view: a small page the server ships with execute_query, profile_table and your business SQL tools. Clients that support MCP Apps, an extension of the Model Context Protocol (MCP), show it under the tool call. Claude does, and so does the example web app.
A grid first, a chart on request
The view opens on a grid you can sort and filter. A chart is one click away on the Chart tab. It opens on the chart only when someone asked for one: the user wrote “as a chart” or “show me a graph”, or a business SQL tool has a chart of its own. The tool description tells the model to send a chart only when the user asks for one, so the lookups it runs on the way to an answer stay tables.
How a chart is chosen
execute_query takes an optional chart argument:
{
  "sql": "SELECT MONTH(ORDDATE) AS MONTH, SUM(AMOUNT) AS TOTAL FROM MYLIB.ORDERS WHERE YEAR(ORDDATE) = 2026 GROUP BY MONTH(ORDDATE) ORDER BY 1",
  "chart": { "type": "line", "x": "MONTH", "y": ["TOTAL"] }
}
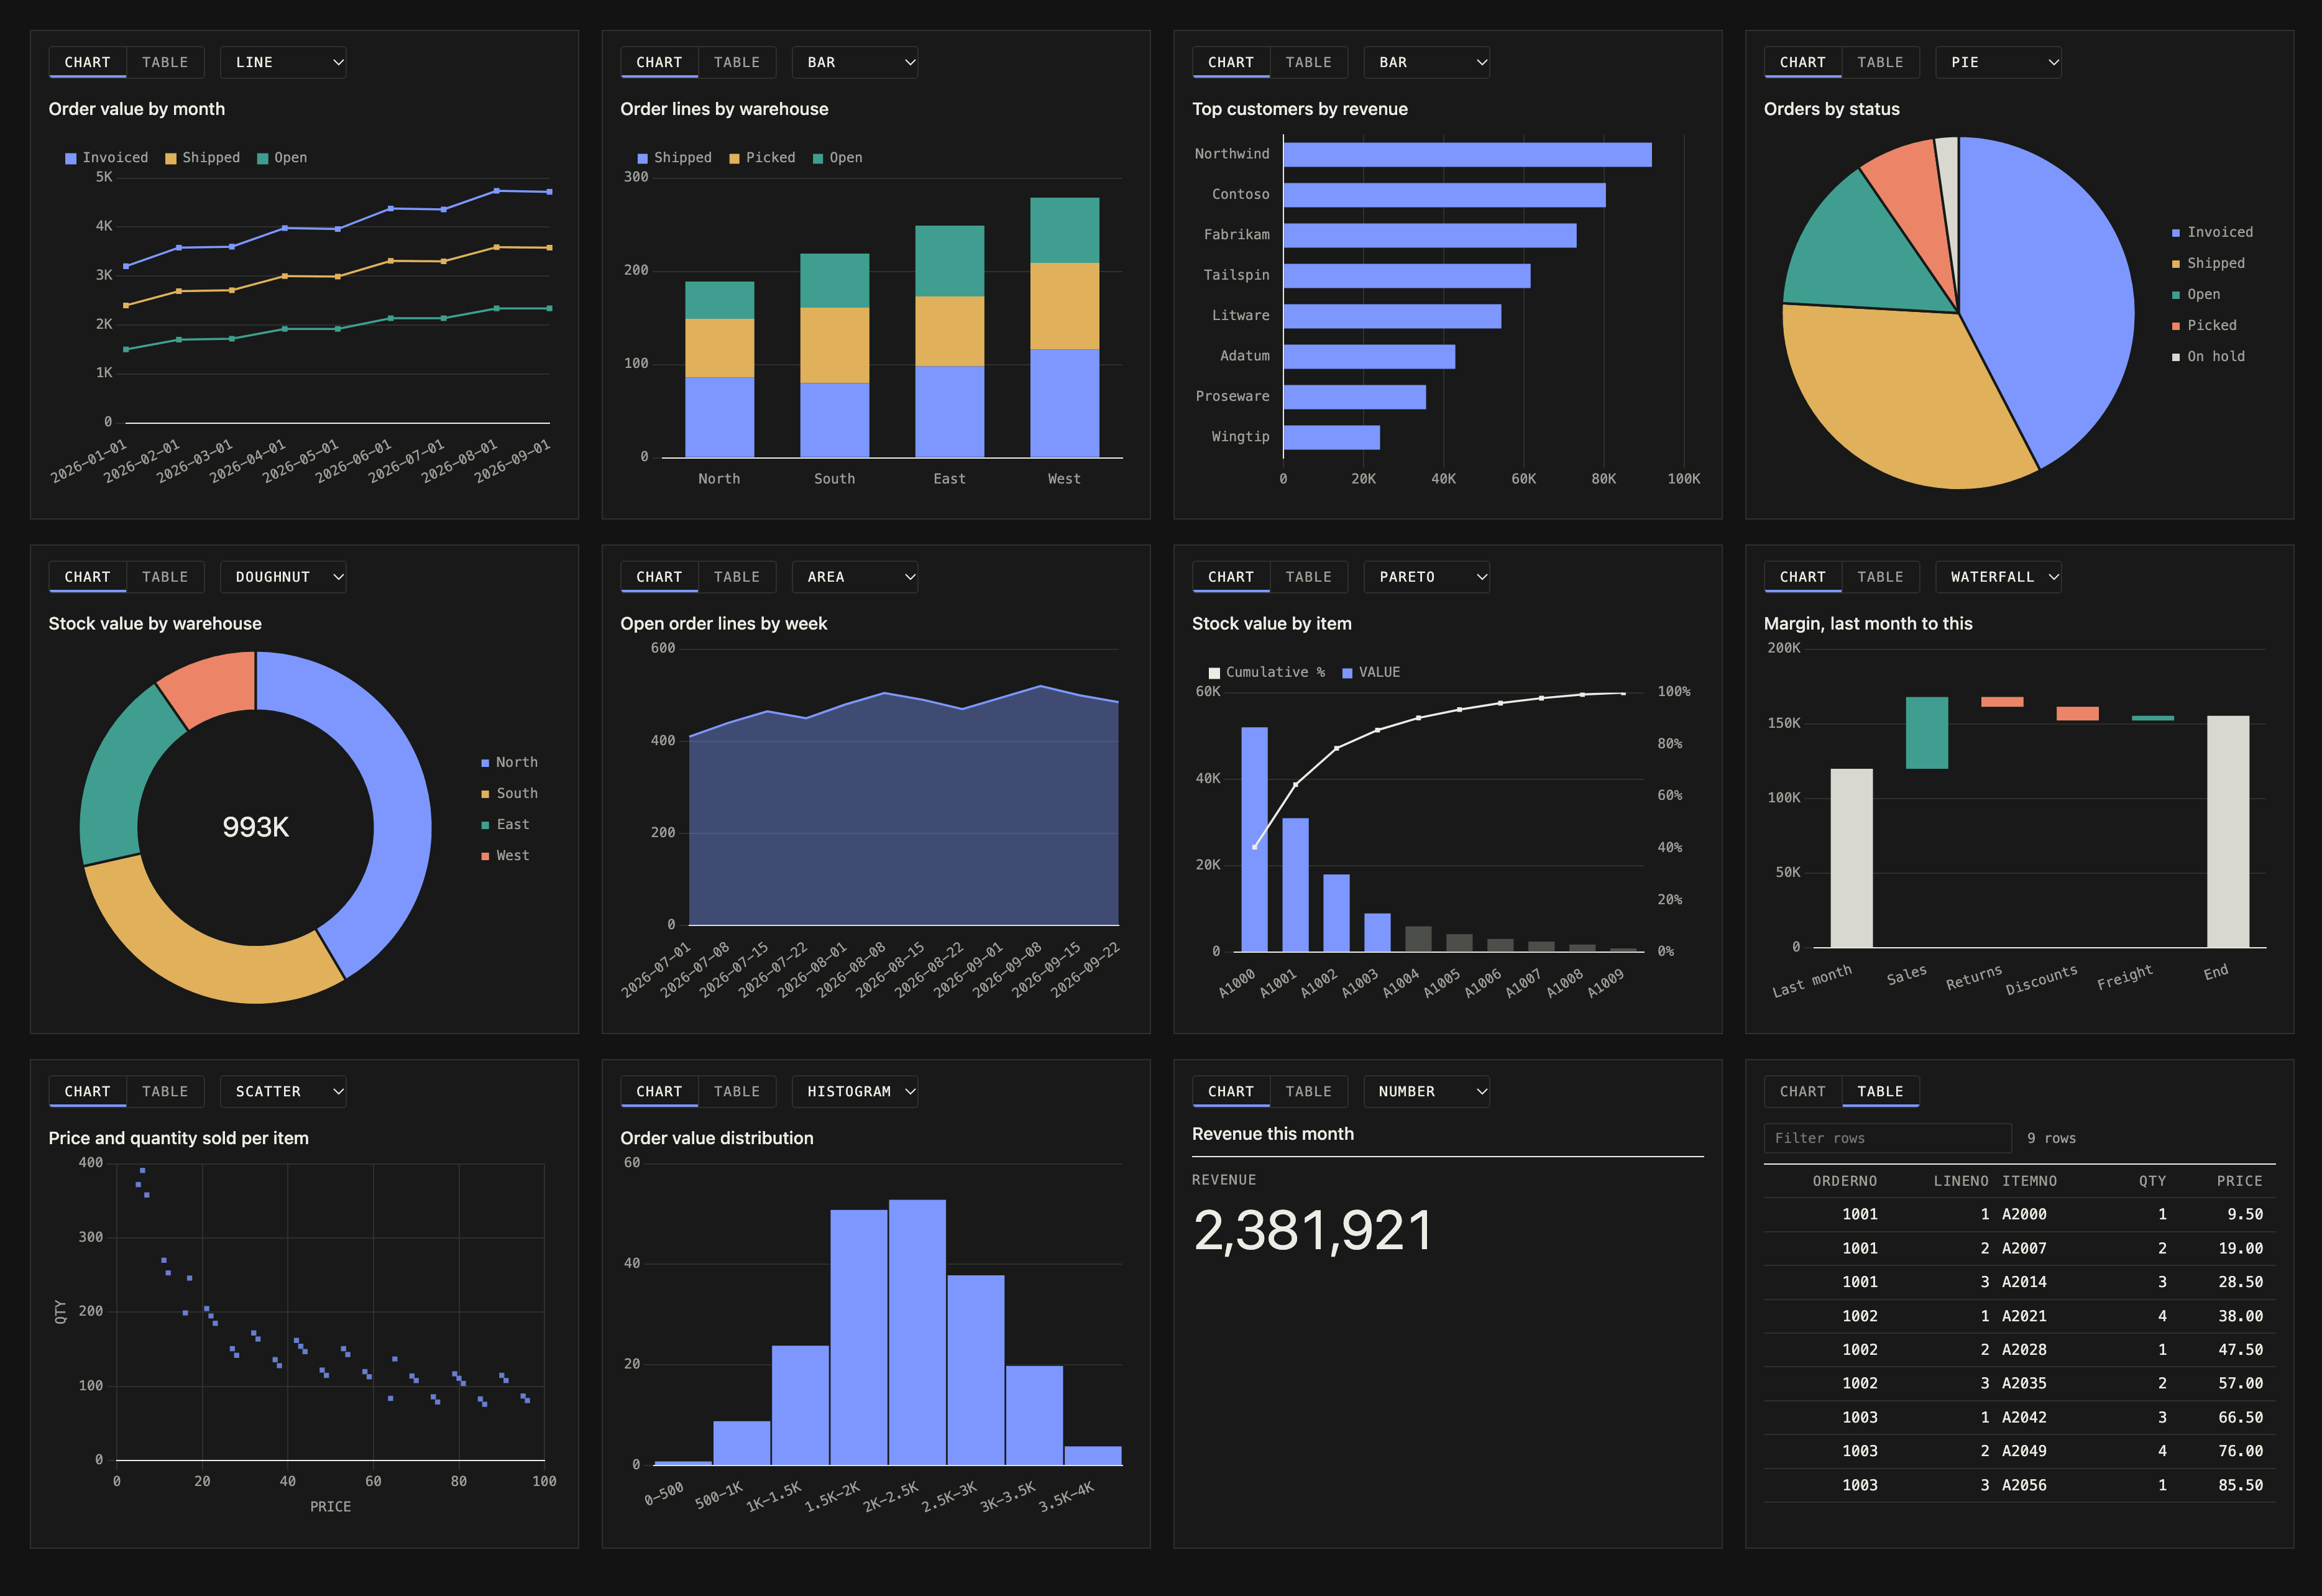
The types are bar, line, area, pie, doughnut, scatter, pareto, waterfall, histogram, KPI tiles, and table for no chart. Every field but type is optional. Column names are checked against the result after the query runs. If a name is wrong, the rows still come back, the hint is dropped and chartError says why.
A business SQL tool can set the same object in a chart: block, so a tool like “orders by status” always opens as the chart you designed:
chart: { type: bar, x: STATUS, y: [TOTAL] }Without a hint, rules pick the chart that sits behind the Chart tab. A date column with numbers becomes a line. One category becomes bars, two become stacked bars, a single row of numbers becomes KPI tiles. A chart draws one measure unless the hint names more, up to three. A split shows the four largest series and adds the rest up as “Other”. More than that is hard to read in a chat.
IBM i details
To tell a measure from a label, the view needs column types, not just JSON values. Results now carry columns, each with a name and a kind such as decimal, date or string, from the driver’s metadata. I checked that ODBC, JT400 and Mapepire report the same kinds.
A few rules come from how IBM i data tends to look:
- Numeric codes such as
ORDERNOandITEMNOare labels. They are never added up. - Dates stored as numbers,
YYYYMMDD, orCYYMMDDin a column with a date-like name, are read as dates. - JT400 returns decimals as strings, and the view parses them.
What it can see
The view is one HTML file built into the server, about 220 KB with Chart.js inside. It reads only the tool result the client hands it, makes no network requests and cannot call tools. Masked columns stay masked, and the result goes through the same read-only connection, SQL validator and library allowlist as before. Set MCP_UI_ENABLED=false and the server no longer offers the view at all.
The example web app runs the view in a sandboxed frame with its own Content Security Policy. Since the tool card already shows the rows, the app shows the view only for results with a chart. The lookups the model runs before its answer stay folded away.
Upgrading
npx mcp-server-db2i@latestThe change is additive. Results gain columns (and chart when there is a hint), and clients without MCP Apps support ignore the view. The result view docs list the chart types, the rules and the settings.
What this means for business users
Ask for the answer as a chart, such as “sales per month this year as a chart”, and it appears under the answer. You can switch between the chart and the table, and sort or filter the table.