Once a team uses the server, the questions change. Who uses it, and do they come back? Which tools do they rely on? What fails, and why? What do people ask for that no report answers yet? The audit log already holds the answers, one JSON line per tool call, but a log group is a hard place to read them. This post shows the setup I run: the audit lines go from CloudWatch Logs to PostHog through a small Lambda function, and a dashboard sits on top. It builds on Running the server on AWS Fargate. The server needs no code changes, and nothing new runs on the IBM i.
The shape
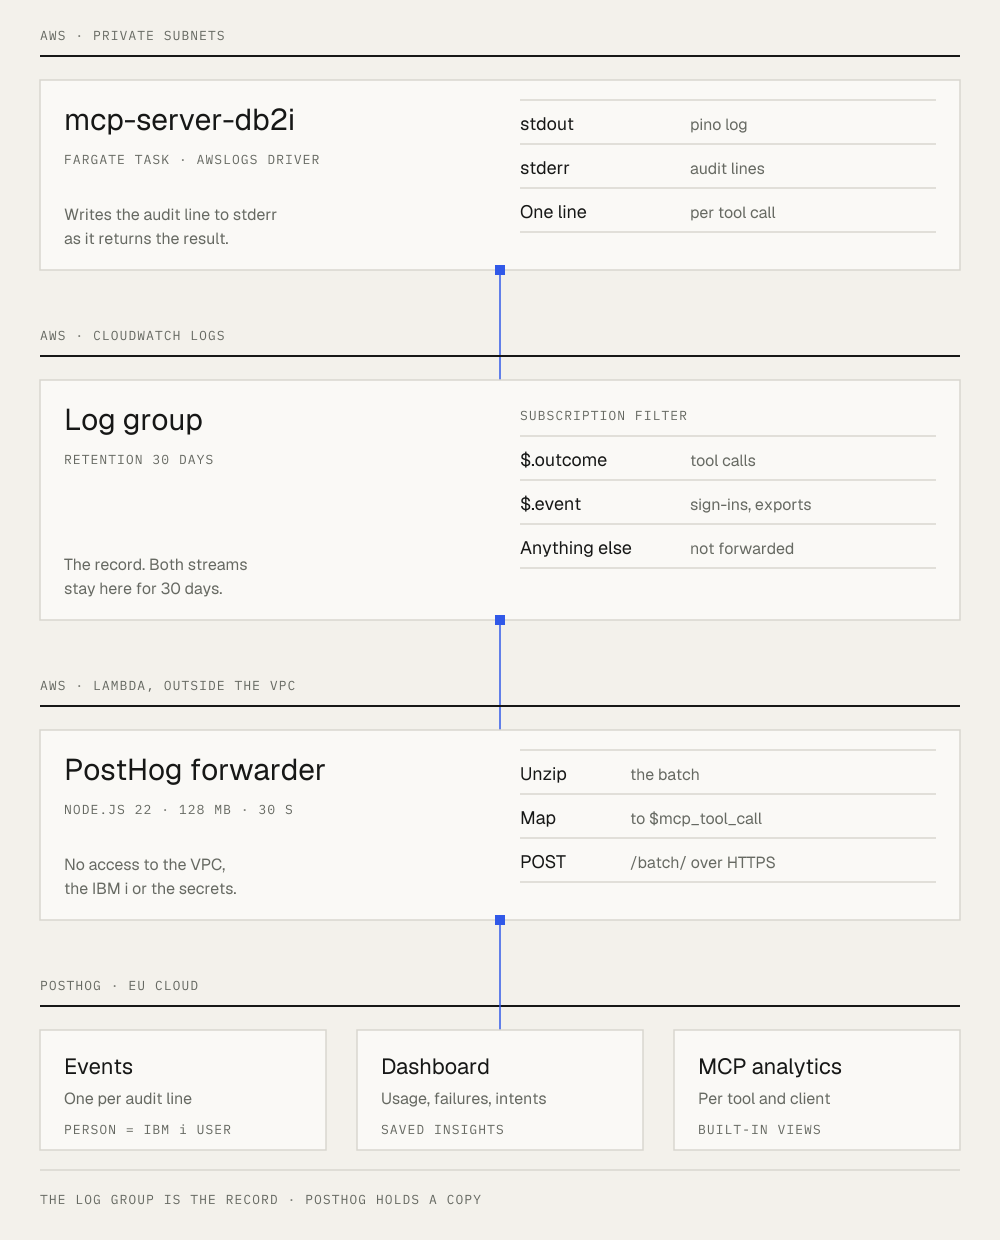
The log group is the record. It keeps every line for 30 days under your AWS account’s access controls. PostHog holds a copy that is easy to read, chart and share inside the team. Everything in this post follows from keeping those two roles apart.
One tool call, end to end
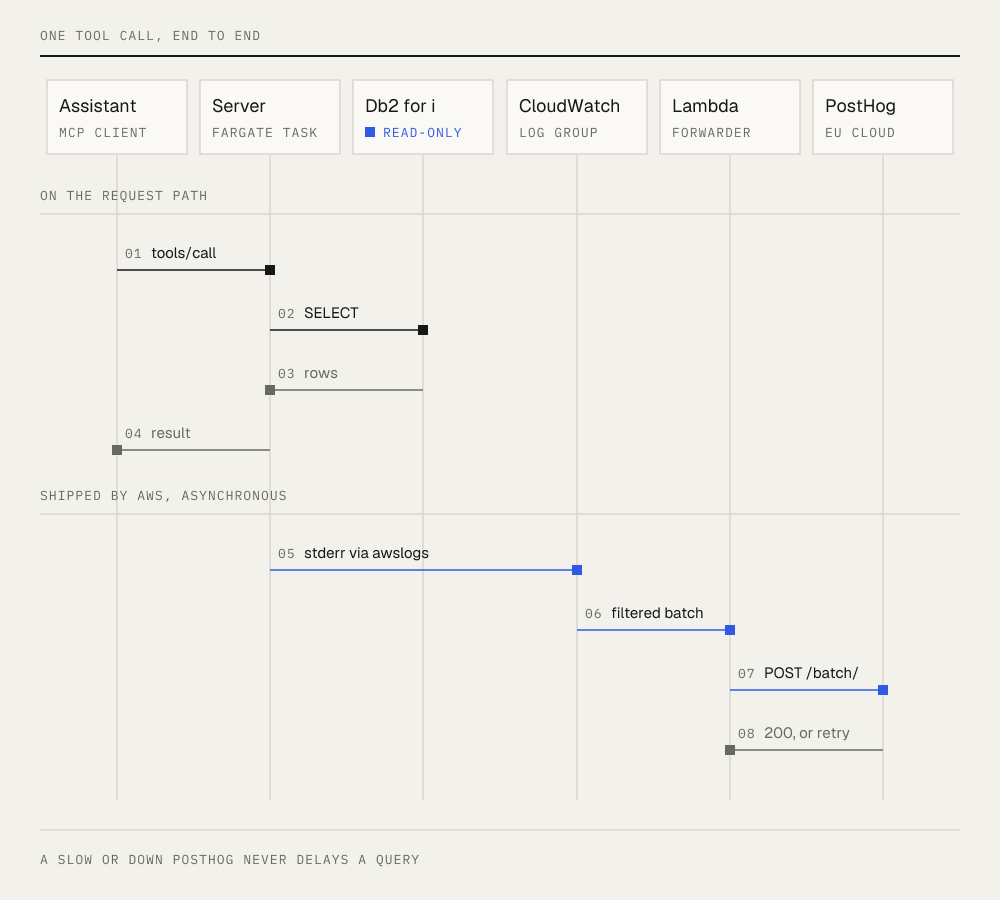
- The assistant calls a tool, for example
execute_query. - The server runs its checks (the SQL validator, the library (schema) allowlist, column masking) and sends the statement to Db2 for i on a read-only connection.
- Db2 returns rows.
- Just before it returns the result, the server writes one audit line to stderr. It is a local write, and a failed write is reported once and never fails the call.
- The ECS
awslogslog driver ships stdout and stderr to the log group. - The subscription filter matches the audit lines. CloudWatch Logs gzips them into a batch and invokes the Lambda function asynchronously.
- The function turns each line into a PostHog event and posts the batch to
/batch/. - If PostHog answers with an error, the function throws, and Lambda retries the invocation.
Steps 5 to 8 never touch the request. The assistant has its answer before the line leaves the task.
Step 1: turn on the audit log
The audit log is off by default. These are the settings on the Fargate task:
MCP_AUDIT_LOG=stderr        # one JSON line per tool call, apart from the pino log
MCP_AUDIT_SQL=hash          # sha256 of the statement; full writes the SQL text
MCP_AUDIT_PARAMS=false      # leave bound values out
MCP_TOOL_INTENT=true        # optional: the model says why it made each call
MCP_BUILD_ID=1a2b3c4        # the git commit the image was built from
A tool call then produces a line like this (formatted here for reading):
{
  "time": "2026-11-14T07:42:10.118Z",
  "serverVersion": "3.8.7",
  "build": "1a2b3c4",
  "tool": "execute_query",
  "identity": "JSMITH",
  "system": "default",
  "sql": "sha256:3b7e0c…",
  "outcome": "success",
  "intent": "Open order lines due this week for one customer",
  "client": { "name": "claude-ai", "version": "0.1.0" },
  "session": "4be1c09a77d2",
  "paramCount": 1,
  "rowCount": 42,
  "durationMs": 312
}
identity is the IBM i user profile that signed in, since every HTTP user signs in with their own. A failed call adds errorKind, rejectedBy, sqlstate and sqlcode, so you can tell a library outside the allowlist from a Db2 error. Sign-ins at the OAuth page write their own lines with "event": "sign_in", and export downloads with "event": "export_download". The security docs list every field.
Step 2: the log group and the filter
In the CDK stack, the container logs to one log group, and a subscription filter sends the audit lines on:
const logGroup = new logs.LogGroup(this, 'Logs', {
  logGroupName: '/ecs/db2i-mcp',
  retention: logs.RetentionDays.ONE_MONTH,
});
// In the container definition:
// logging: ecs.LogDrivers.awsLogs({ logGroup, streamPrefix: 'app' })

new logs.SubscriptionFilter(this, 'AuditToPostHog', {
  logGroup,
  destination: new logsDestinations.LambdaDestination(forwarder),
  filterPattern: logs.FilterPattern.any(
    logs.FilterPattern.exists('$.outcome'),
    logs.FilterPattern.exists('$.event'),
  ),
});
Tool call lines carry outcome and event lines carry event. In my setup the pino log is plain text, so the filter can’t match it, and it stays in the log group. If your pino log is JSON (NODE_ENV=production), check that none of its lines carries either field.
Step 3: the forwarder
The function is about 200 lines of plain Node.js with no dependencies. This is the core, trimmed:
import { gunzipSync } from 'node:zlib';

const HOST = process.env.POSTHOG_HOST ?? 'https://eu.i.posthog.com';
const API_KEY = process.env.POSTHOG_API_KEY;

export async function handler(input) {
  const payload = JSON.parse(gunzipSync(Buffer.from(input.awslogs.data, 'base64')).toString('utf8'));
  if (payload.messageType !== 'DATA_MESSAGE') return;

  const batch = [];
  for (const logEvent of payload.logEvents) {
    try {
      const event = toPostHog(JSON.parse(logEvent.message), logEvent.timestamp);
      if (event) batch.push(event);
    } catch {
      // not a JSON line
    }
  }
  if (batch.length === 0) return;

  const response = await fetch(`${HOST}/batch/`, {
    method: 'POST',
    headers: { 'Content-Type': 'application/json' },
    body: JSON.stringify({ api_key: API_KEY, batch }),
  });
  if (!response.ok) {
    // Throwing makes Lambda retry the asynchronous invocation
    throw new Error(`PostHog batch failed: ${response.status}`);
  }
  console.log(`Sent ${batch.length} events`);
}

function toPostHog(line, fallbackTime) {
  if (line.tool === undefined || line.outcome === undefined) return undefined; // sign-ins: below
  const isError = line.outcome !== 'success';
  return {
    event: '$mcp_tool_call',
    distinct_id: String(line.identity).toLowerCase(), // IBM i profiles are case-insensitive
    timestamp: line.time ?? new Date(fallbackTime).toISOString(),
    properties: {
      $mcp_server_name: 'mcp-server-db2i',
      $mcp_server_version: line.serverVersion,
      $mcp_tool_name: line.tool,
      $mcp_is_error: isError,
      $mcp_duration_ms: line.durationMs,
      $mcp_intent: line.intent,
      $mcp_client_name: line.client?.name,
      $mcp_session_id: line.session,
      ...(isError ? { $mcp_error_type: line.errorKind ?? 'other' } : {}),
      db2i_outcome: line.outcome,
      db2i_row_count: line.rowCount,
      db2i_sql: line.sql,
      db2i_sqlstate: line.sqlstate,
      db2i_rejected_by: line.rejectedBy,
    },
  };
}
Tool calls become PostHog’s own $mcp_tool_call event, so PostHog’s MCP analytics views (calls, errors, duration, clients and intents per tool) work without any setup. The full version does a few more things:
| Audit line | PostHog event | Person |
|---|---|---|
| Tool call | $mcp_tool_call |
The IBM i user, in lower case |
sign_in |
db2i_sign_in |
Created on success only. A failed sign-in may carry a mistyped name |
export_download |
db2i_export_download |
The user who ran the export |
shutdown and other events |
db2i_server_<event> |
None |
It also cuts SQL, intent and error text at 8,000 characters, and reads the client name from the User-Agent when the client sends none.
The function itself, in the same stack:
const forwarder = new lambda.Function(this, 'PostHogForwarder', {
  runtime: lambda.Runtime.NODEJS_22_X,
  handler: 'index.handler',
  code: lambda.Code.fromAsset(path.join(__dirname, '..', 'lambda', 'posthog-forwarder')),
  timeout: Duration.seconds(30),
  memorySize: 128,
  environment: {
    POSTHOG_HOST: 'https://eu.i.posthog.com',
    POSTHOG_API_KEY: posthogProjectToken,
  },
  logGroup: new logs.LogGroup(this, 'PostHogForwarderLogs', {
    retention: logs.RetentionDays.ONE_WEEK,
  }),
});
There is no vpc property on purpose. The function runs outside the VPC, so it has no route to the IBM i. LambdaDestination adds the permission that lets CloudWatch Logs invoke the function, limited to this log group.
Step 4: the dashboard
My dashboard has twelve tiles in four groups:
- Adoption: weekly active users, new, returning and dormant users, weekly retention, and days active in the last 30 days.
- Usage: calls by tool, users by client, the 95th percentile duration by tool, and a roster of everyone who signed in or made a call in the last 90 days.
- Problems: failed calls by type, sign-ins by outcome, and the 100 latest failed calls with the tool, error type, SQLSTATE, SQL and intent.
- Demand: the latest intents, newest first.
The adoption tiles use PostHog’s test account filter to leave out my own profile, so they count other people. The problem and demand tables show everyone.
The latest failed calls are where I find gaps in the allowlist parser and tools that break. The latest intents show what people ask for before anyone has built a report for it.
My deployment sends a few thousand events a month. That fits well inside PostHog’s free monthly allowance, and the Lambda and CloudWatch costs at that volume are small.
Finding the next business tool
Business SQL tools are named, read-only queries that an administrator writes once in YAML, with parameters, the right filters and the joins your ERP needs. The model picks one when it answers the question, instead of writing its own SQL. The hard part is knowing which ones to write. The audit log in PostHog answers that from what people actually do.
The same ad hoc query, again and again. Every execute_query call is the model writing SQL of its own. When the same statement, or the same question in the intents, comes back week after week, it is a candidate for a business tool. A named tool gives the same answer every time, runs faster, and saves the model from finding the tables again. This query in PostHog’s SQL editor lists the most repeated ones:
SELECT
  properties.db2i_sql AS statement,
  count() AS calls,
  uniq(distinct_id) AS users,
  countIf(properties.$mcp_is_error = true) AS failed,
  any(properties.$mcp_intent) AS sample_intent
FROM events
WHERE event = '$mcp_tool_call'
  AND properties.$mcp_tool_name = 'execute_query'
  AND timestamp > now() - INTERVAL 30 DAY
GROUP BY statement
ORDER BY calls DESC
LIMIT 50
Two things to know when you read it. Grouping by the statement text only joins identical statements, so the same question written with another alias or another literal counts twice. Read the intents next to it. And with MCP_AUDIT_SQL=hash the statement column is a hash: you still see that something repeats and how often, but only the intent tells you what it asks.
Failures in the same place. Group the failed calls by the check that refused them:
SELECT
  properties.db2i_rejected_by AS rejected_by,
  properties.$mcp_error_type AS error_type,
  properties.db2i_sqlstate AS sqlstate,
  count() AS calls,
  any(properties.db2i_sql) AS sample_sql,
  any(properties.$mcp_intent) AS sample_intent
FROM events
WHERE event = '$mcp_tool_call'
  AND properties.$mcp_is_error = true
  AND timestamp > now() - INTERVAL 30 DAY
GROUP BY rejected_by, error_type, sqlstate
ORDER BY calls DESC- Column or table not found (
rejected_byisdb2, SQLSTATE42S22or42S02with the ODBC driver,42703or42704from Db2 itself): the model is guessing names. Table notes help, and for a question that keeps coming back, a business tool that already knows the columns. allowlist: the model reached for a library outsideQUERY_ALLOWED_SCHEMAS. Either the library belongs in the list, or a business tool should answer from the library that holds the right data.parse_check: the statement does not parse. A few of these are normal. Many on the same kind of question mean the question deserves a tool.
Skipped row filters. skippedFilters (db2i_skipped_filters in PostHog) names the annotated tables whose row filter a statement left out, such as the flag that marks deleted rows. When the same table shows up again and again, the answer depends on a rule the model keeps forgetting. A business tool puts the filter in its SQL, where it cannot be forgotten.
Checking that it worked. After you add a tool, the Calls by tool tile shows whether people’s assistants pick it up, and the same question should show up less often as execute_query.
Security: copying an audit log to another service
The security docs say to think twice before sending the audit log to a third-party service. This setup does exactly that, so these are the decisions I made, and where each one is enforced.
Decide what leaves AWS. The server decides what goes into the line, and the forwarder copies what it maps:
| Setting | What reaches PostHog |
|---|---|
MCP_AUDIT_SQL=hash (default) |
A SHA-256 of the statement, enough to count repeats |
MCP_AUDIT_SQL=full |
The SQL text, including any literal values in it |
MCP_AUDIT_PARAMS=true |
Bound values. The forwarder copies them when present; leave this off |
MCP_TOOL_INTENT=true |
The model’s one-sentence summary of what the user asked |
I run with full SQL and intents, because the failed calls are only useful to me with the statement next to them. Start with hash and turn on more only when you will read it.
Treat it as personal data. User names, SQL and intents identify people and can contain customer names or order numbers. Tell your users what is recorded and why, have a legal basis for it (under GDPR, for example), and sign PostHog’s data processing agreement. I use PostHog’s EU cloud, so the copy stays in the EU.
Leave IP addresses out. The server writes the client’s IP address on sign-in and export download lines. The forwarder does not copy it. PostHog would otherwise store the address that sent the batch, which is the function’s, not the user’s. Turn on Discard client IP data under Settings, Project, IP data capture configuration. EU organizations get it on by default for new projects.
The project token is an ingest key. It can send events to the project and cannot read anything, which is why it sits in the function’s environment rather than in Secrets Manager. Keep it out of public repos all the same: anyone who has it can send made-up events to your project. That is one more reason the dashboard is not evidence.
What the function can reach. It runs outside the VPC, with no security group, no route to the IBM i and no access to Secrets Manager. Its role writes its own logs and nothing else. It cannot read the log group; it only receives the batches CloudWatch Logs pushes to it. Its own log says how many events it sent, never their content, and keeps that for a week.
Who can read PostHog. Every member of the PostHog project sees the SQL and the intents. Give access to the people who would be allowed to read the log group, require two-factor sign-in or SSO, and keep dashboards unshared.
The record stays in AWS. Lambda retries a failed asynchronous invocation twice. If PostHog is down for longer than that, those events never reach PostHog unless you add an on-failure destination, and a retry after a partial failure can send a batch twice. So PostHog is right for trends and wrong for “who ran this statement on March 3”. That question goes to the log group, which IAM controls and which keeps every line for 30 days. If you need it longer, export the log group to S3 with Object Lock.
Back pressure. A slow or down PostHog cannot slow a query: the forwarder runs after the fact. The log driver is the one place to check. In blocking mode, a container that cannot deliver its logs to CloudWatch eventually waits on its next write to stdout or stderr. In non-blocking mode it drops lines when its buffer fills, which means gaps in the audit log. Set the mode of the awslogs driver on purpose instead of relying on the default.
What enforces what
- The server: what goes into each audit line (
MCP_AUDIT_SQL,MCP_AUDIT_PARAMS,MCP_TOOL_INTENT). - CloudWatch Logs: the record, its retention and who can read it (IAM).
- The subscription filter: which lines leave the log group.
- The forwarder: which fields reach PostHog. IP addresses do not.
- PostHog: who can see the copy, whether IP addresses are stored, and how long events are kept.
What next?
The forwarder lives in my own deployment, not in the repo. If you send the audit log somewhere else, such as Grafana Loki, Datadog or Splunk, a pull request that adds your setup to the docs is welcome.